Sunspots
As we head down into the sunspot number trench that looks to be as deep as 2009, we can correlate QSO data from a state QSO Party to understand the effects on propagation. The graph below shows the NOAA graph of sun spot activity over the years. 2014 was the last peak. 2009 is the most recent minimum with 2017 sliding downward towards the next.
Virginia QSO Party
I crunch data for the Virginia QSO Party every year. It provides valuable insight into what modes, bands, etc. offer the most bang for the buck over the period of the weekend contest. With data from 2006 to 2017, we finally have enough data to examine the eleven year sunspot cycle. Let’s examine the breakdown by band for 2014 and 2017 focusing only on QSOs made between Virginia stations.
Virginia to Virginia QSOs over the years
The following two graphs breakdown the Virginia to Virginia QSOs made by every participant in the VaQP. The first shows totals and the second by percentage.
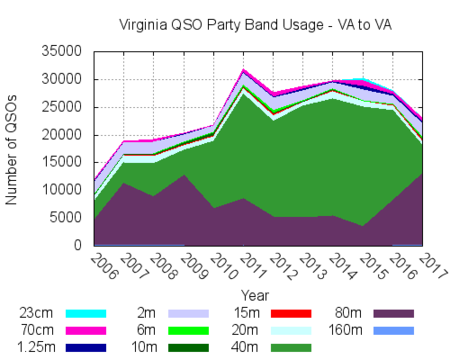
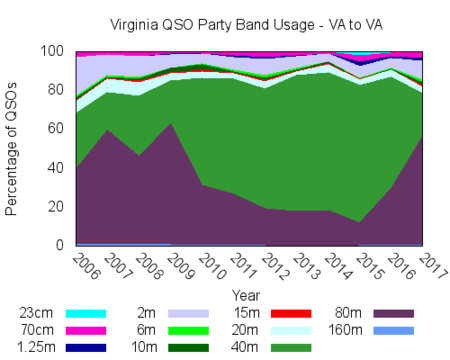
The second graph better portrays band usage after normalizing to each year’s total QSOs.
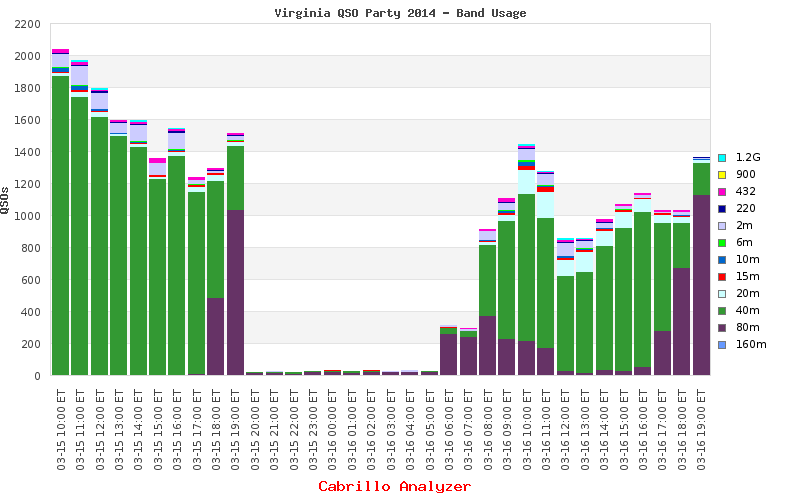
Using QSO data for analysis like this has issues, see below, but the correlation between the sunspot and band usage seems promising. Let focus on the recent 2014 peak and the 2017 data.
In state QSOs by band in 2014
In state QSOs by band in 2017
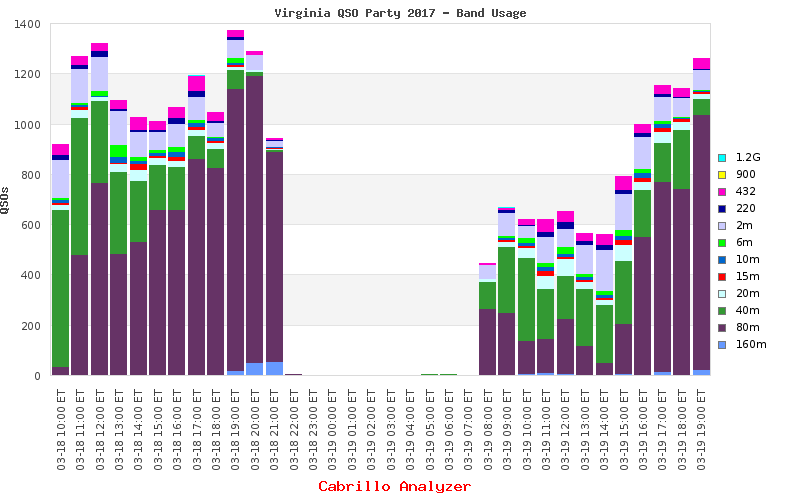
Click either image for larger view.
On both graphs the “money” bands are 40m (in green) and 80 meters (in purple). 80m is a necessary nighttime band during peak sunspot years, but 80m was a killer daytime band in 2017. 160m should be good as well, but as you can see in the light blue there just aren’t many 160m QSOs. I suspect few have the antenna real estate for this band, but everyone has something for 80m… right?
Observations
40m is always an important band for instate NVIS QSOs, but 80m really shines during low sunspot years both day and night. This will likely be the case for the next two years. Here is a snap shot of the Wallops Island ionogram during late afternoon January 26th…
Here is the link to the live ionogram at Wallops. The wise will bookmark this link right away.
Note the lack of 40m reflection at zenith. Keep in mind the Wallops sounder measures Vertical Incident Skywave (VIS) not Near-Vertical Incident Skywave (NVIS). The reality is most communications are of the NVIS type as this figure from the Army FM 24-18 field manual reminds us.
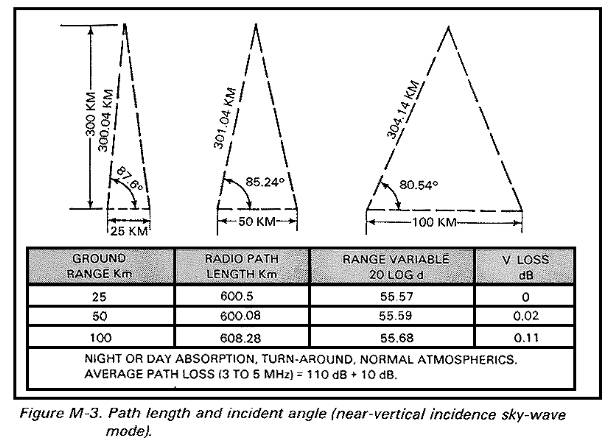
Don’t make the mistake of thinking NVIS propagation doesn’t exist at angles away from zenith for frequencies above the Wallops data.
The perils of univariate analysis
The observable trends result from risky univariant analysis based on the assumption band usage actually reflects band openings. The notion is since everyone wants to perform well during the QSO Party, they will experimentally test and then select bands that reap rewards. Since Virginia counties and independent cities yield score multipliers, there is a reward for operators to flock to bands that add those counties and cities to their tally. Unfortunately this broad assumption includes short range groundwave QSOs, QSOs between packs of roving mobiles, etc. As well, daily propagation variations from events like solar storms are not represented. The only filtering done on the data was to include only QSOs between stations in Virginia be they separated by hundreds of miles or a few yards. Additionally this clumsily removes unwanted long haul DX from the analysis at the cost of valid state to state NVIS QSOs.
Further filtering to remove HF ground or space wave QSOs between Virginia stations is possible given we know the location of both to the granularity of the county or city. As well it’s sensible to include QSOs between stations in Virginia and neighboring states within the notional single hop NVIS distance. This is for another time perhaps since the graphs above do show positive correlation to the 11 year sunspot cycle to sufficient extent to make the point of this article.
Conclusion
The eleven year sunspot cycle is always a fun topic for amateur radio operators because we really do live with the real consequences. The QSO data from the Virginia QSO Party likely reveals the practical effect of sunspots on band usage and provides a predictive tool for future events.
Chance favors the prepared. Be sure to add 80m to your NVIS gear during our sunspot low, but don’t omit 40m capability for potential NVIS and especially for longer distance state to state contacts.